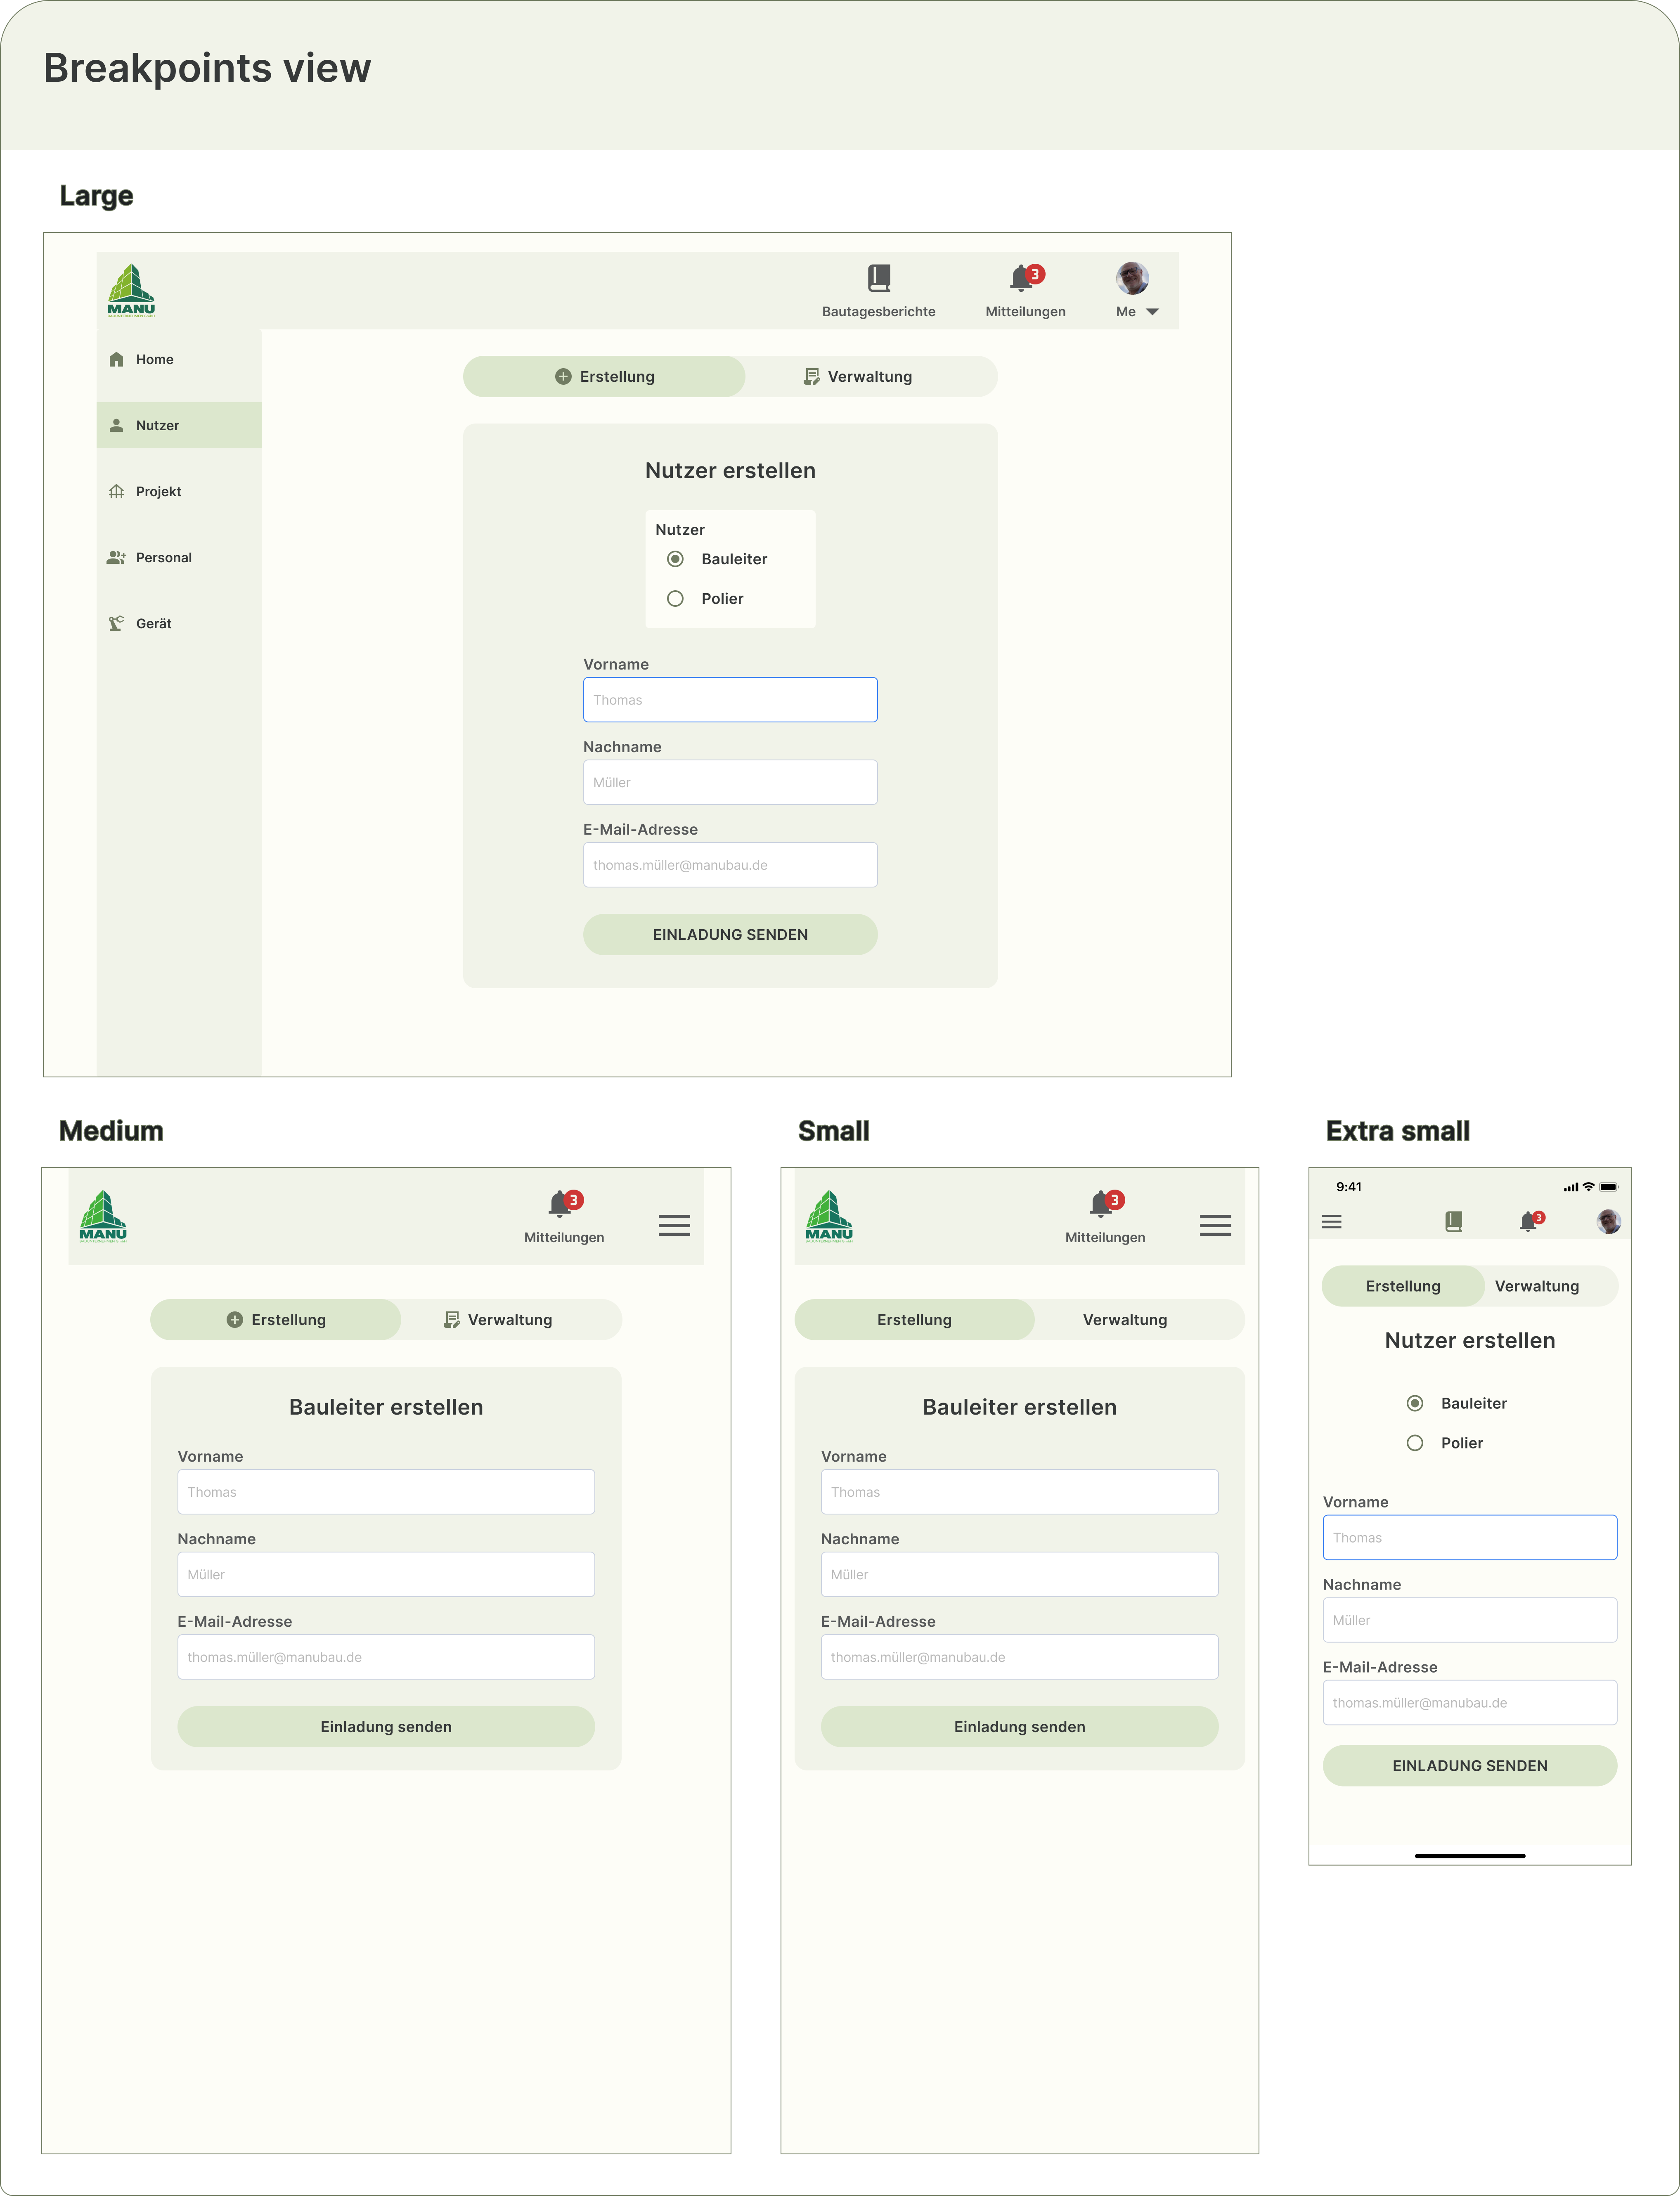
Construction Diary App for Site Supervisors and Dashboard for Admin
Creating a simple app to automate a tedious task that is usually done in Excel spreadsheets in a construction company in Germany
Figma
Problem
Enhancing Construction Project Management Efficiency
In the fast-paced realm of construction, updating crucial project details poses a persistent challenge. Site supervisors diligently collect and organize a wealth of information daily, from weather conditions and personnel involved to the equipment utilized and project status. Traditionally, this data collection process involves a laborious routine of leaving the construction site, returning to the office, and updating an Excel file. This workflow not only consumes valuable time but also introduces the risk of errors and delays in project reporting.

Solution
Streamlined Construction Diary App
A user-friendly app designed specifically for Site supervisors to seamlessly update project information right at the construction site. This mobile application offers both online and offline functionality, ensuring that data can be captured regardless of internet connectivity. The intuitive interface allows Site supervisors to input details effortlessly, covering everything from daily weather conditions and personnel tracking to equipment usage and project milestones. Reports can be generated instantly and shared directly with project leaders and clients, fostering real-time communication and enhancing overall project management efficiency.
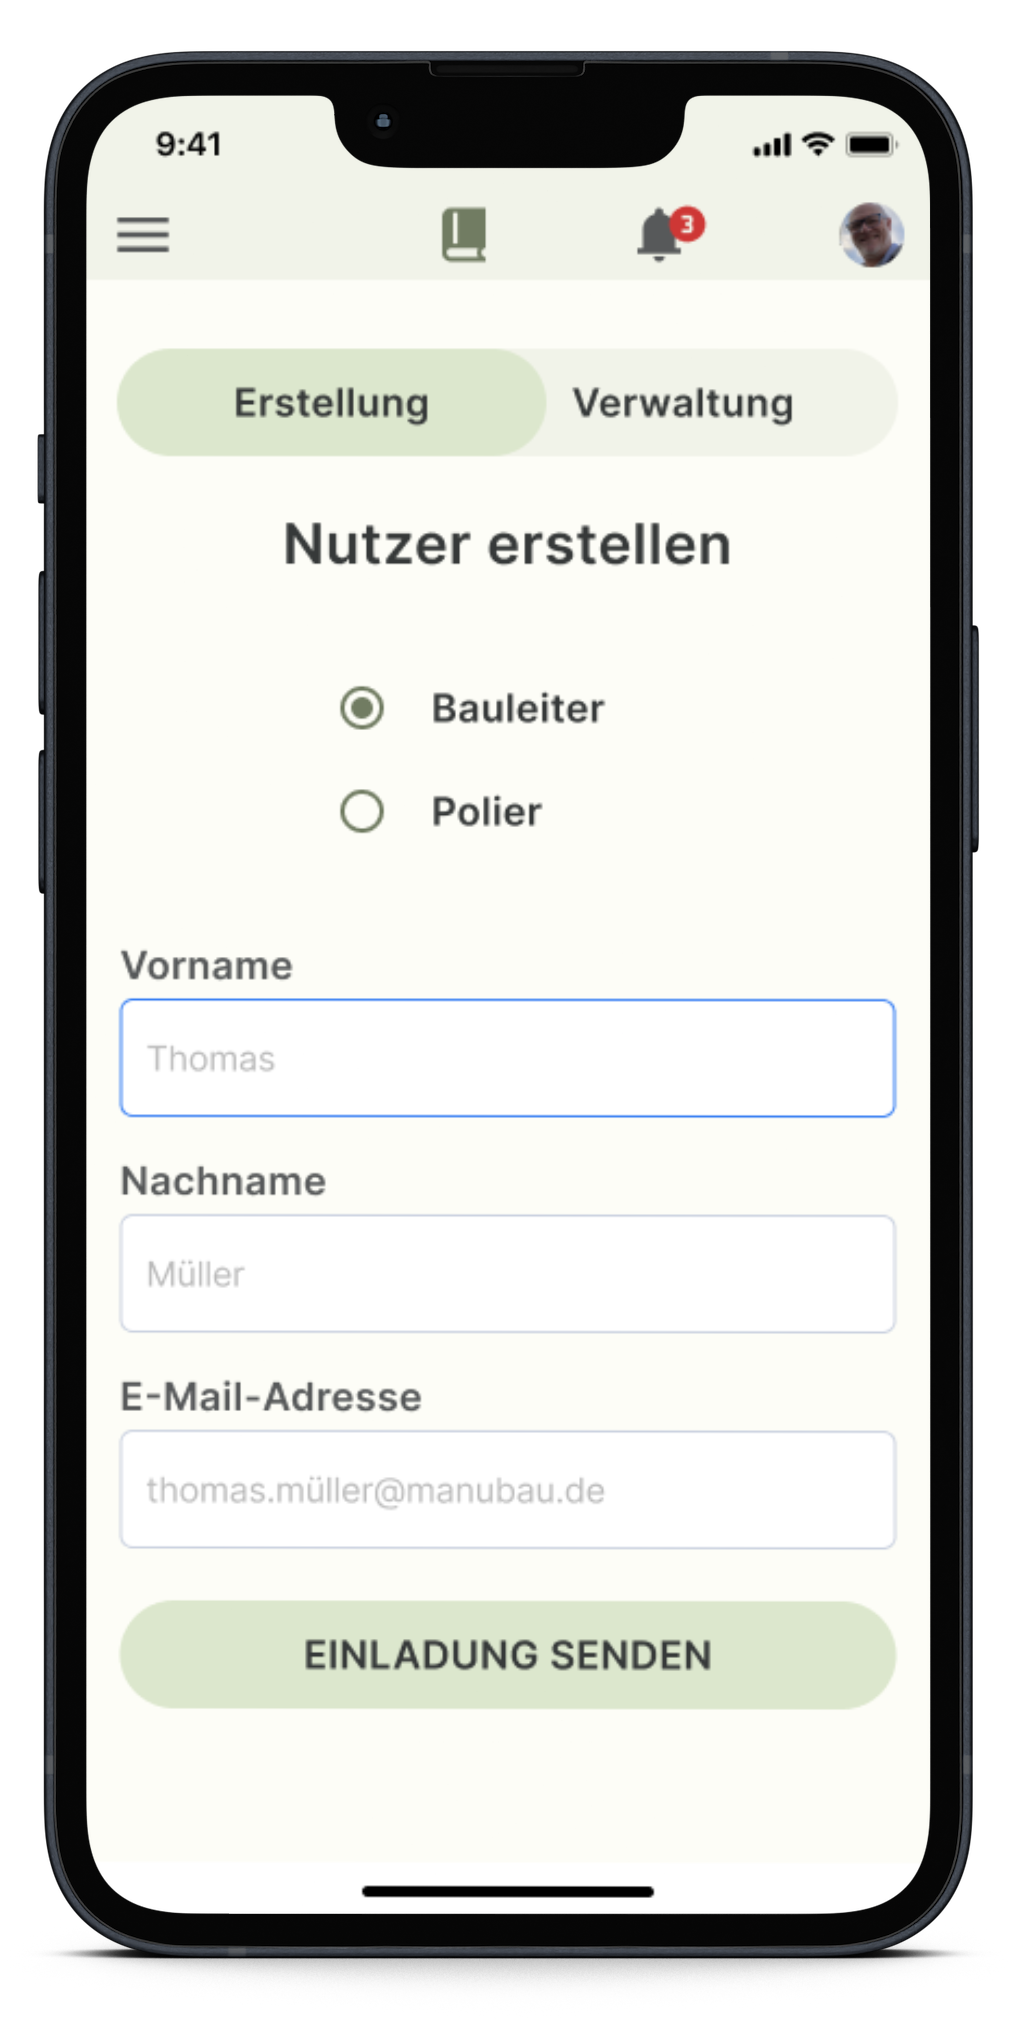
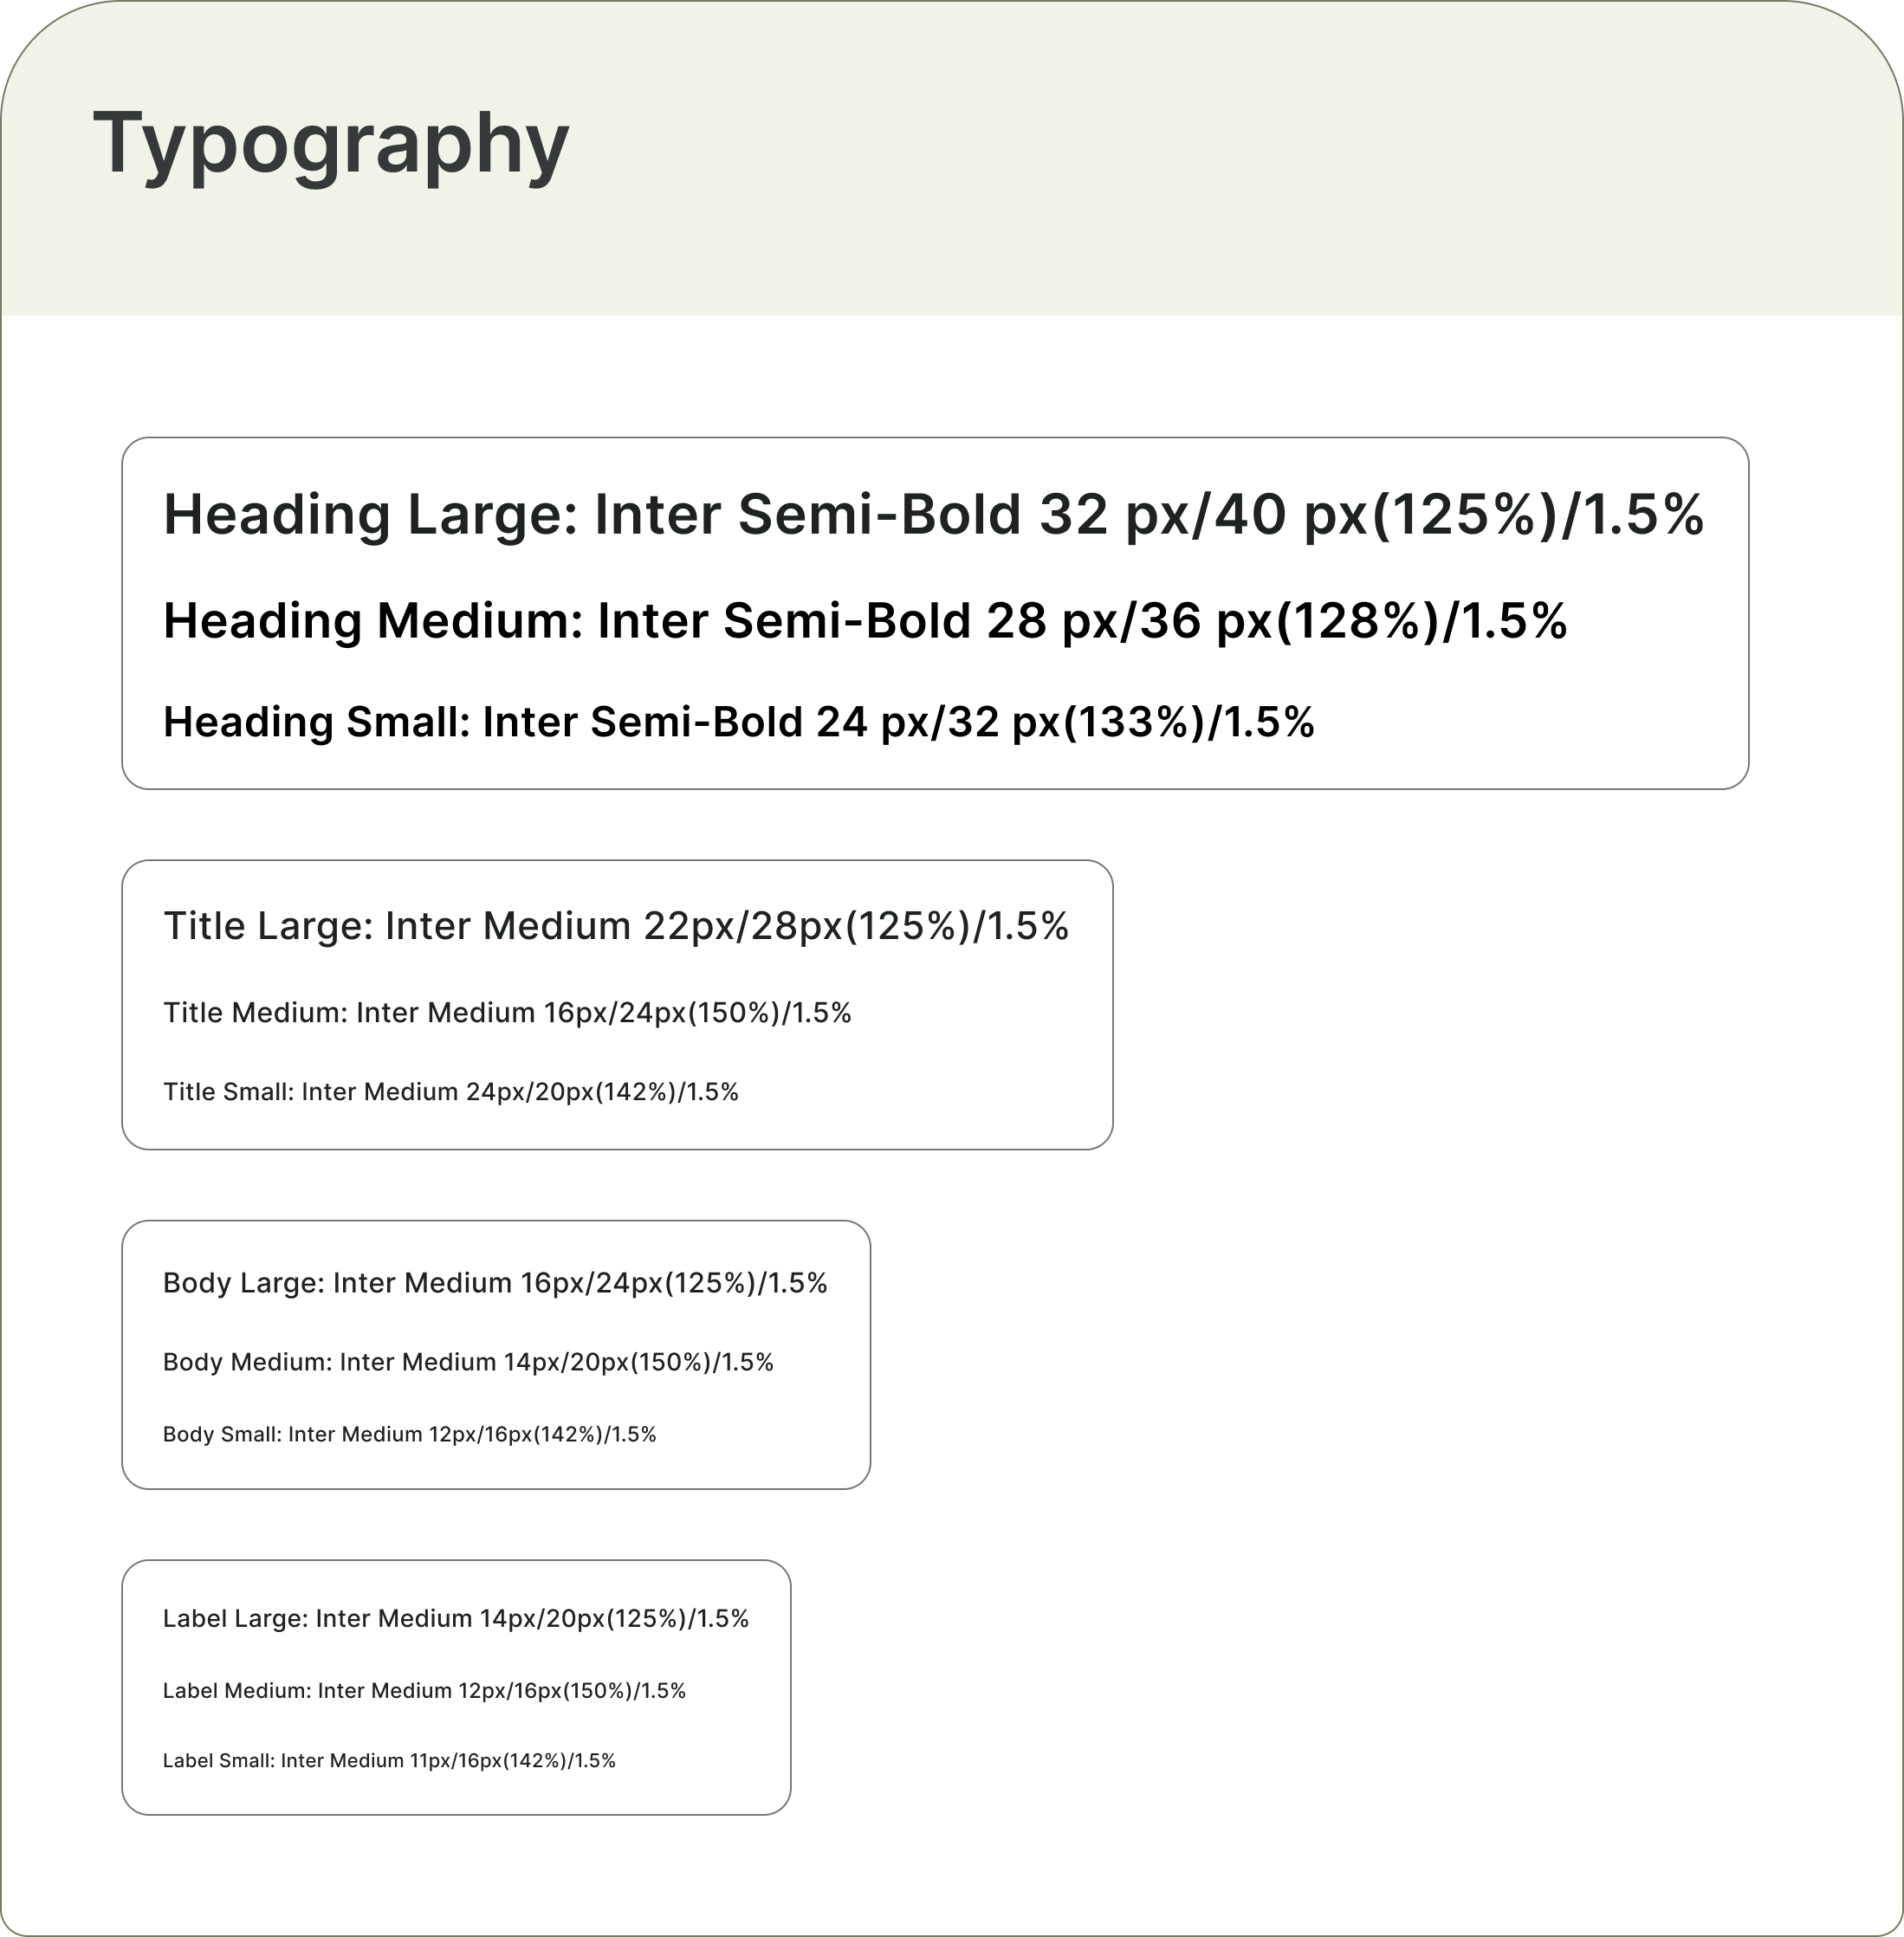
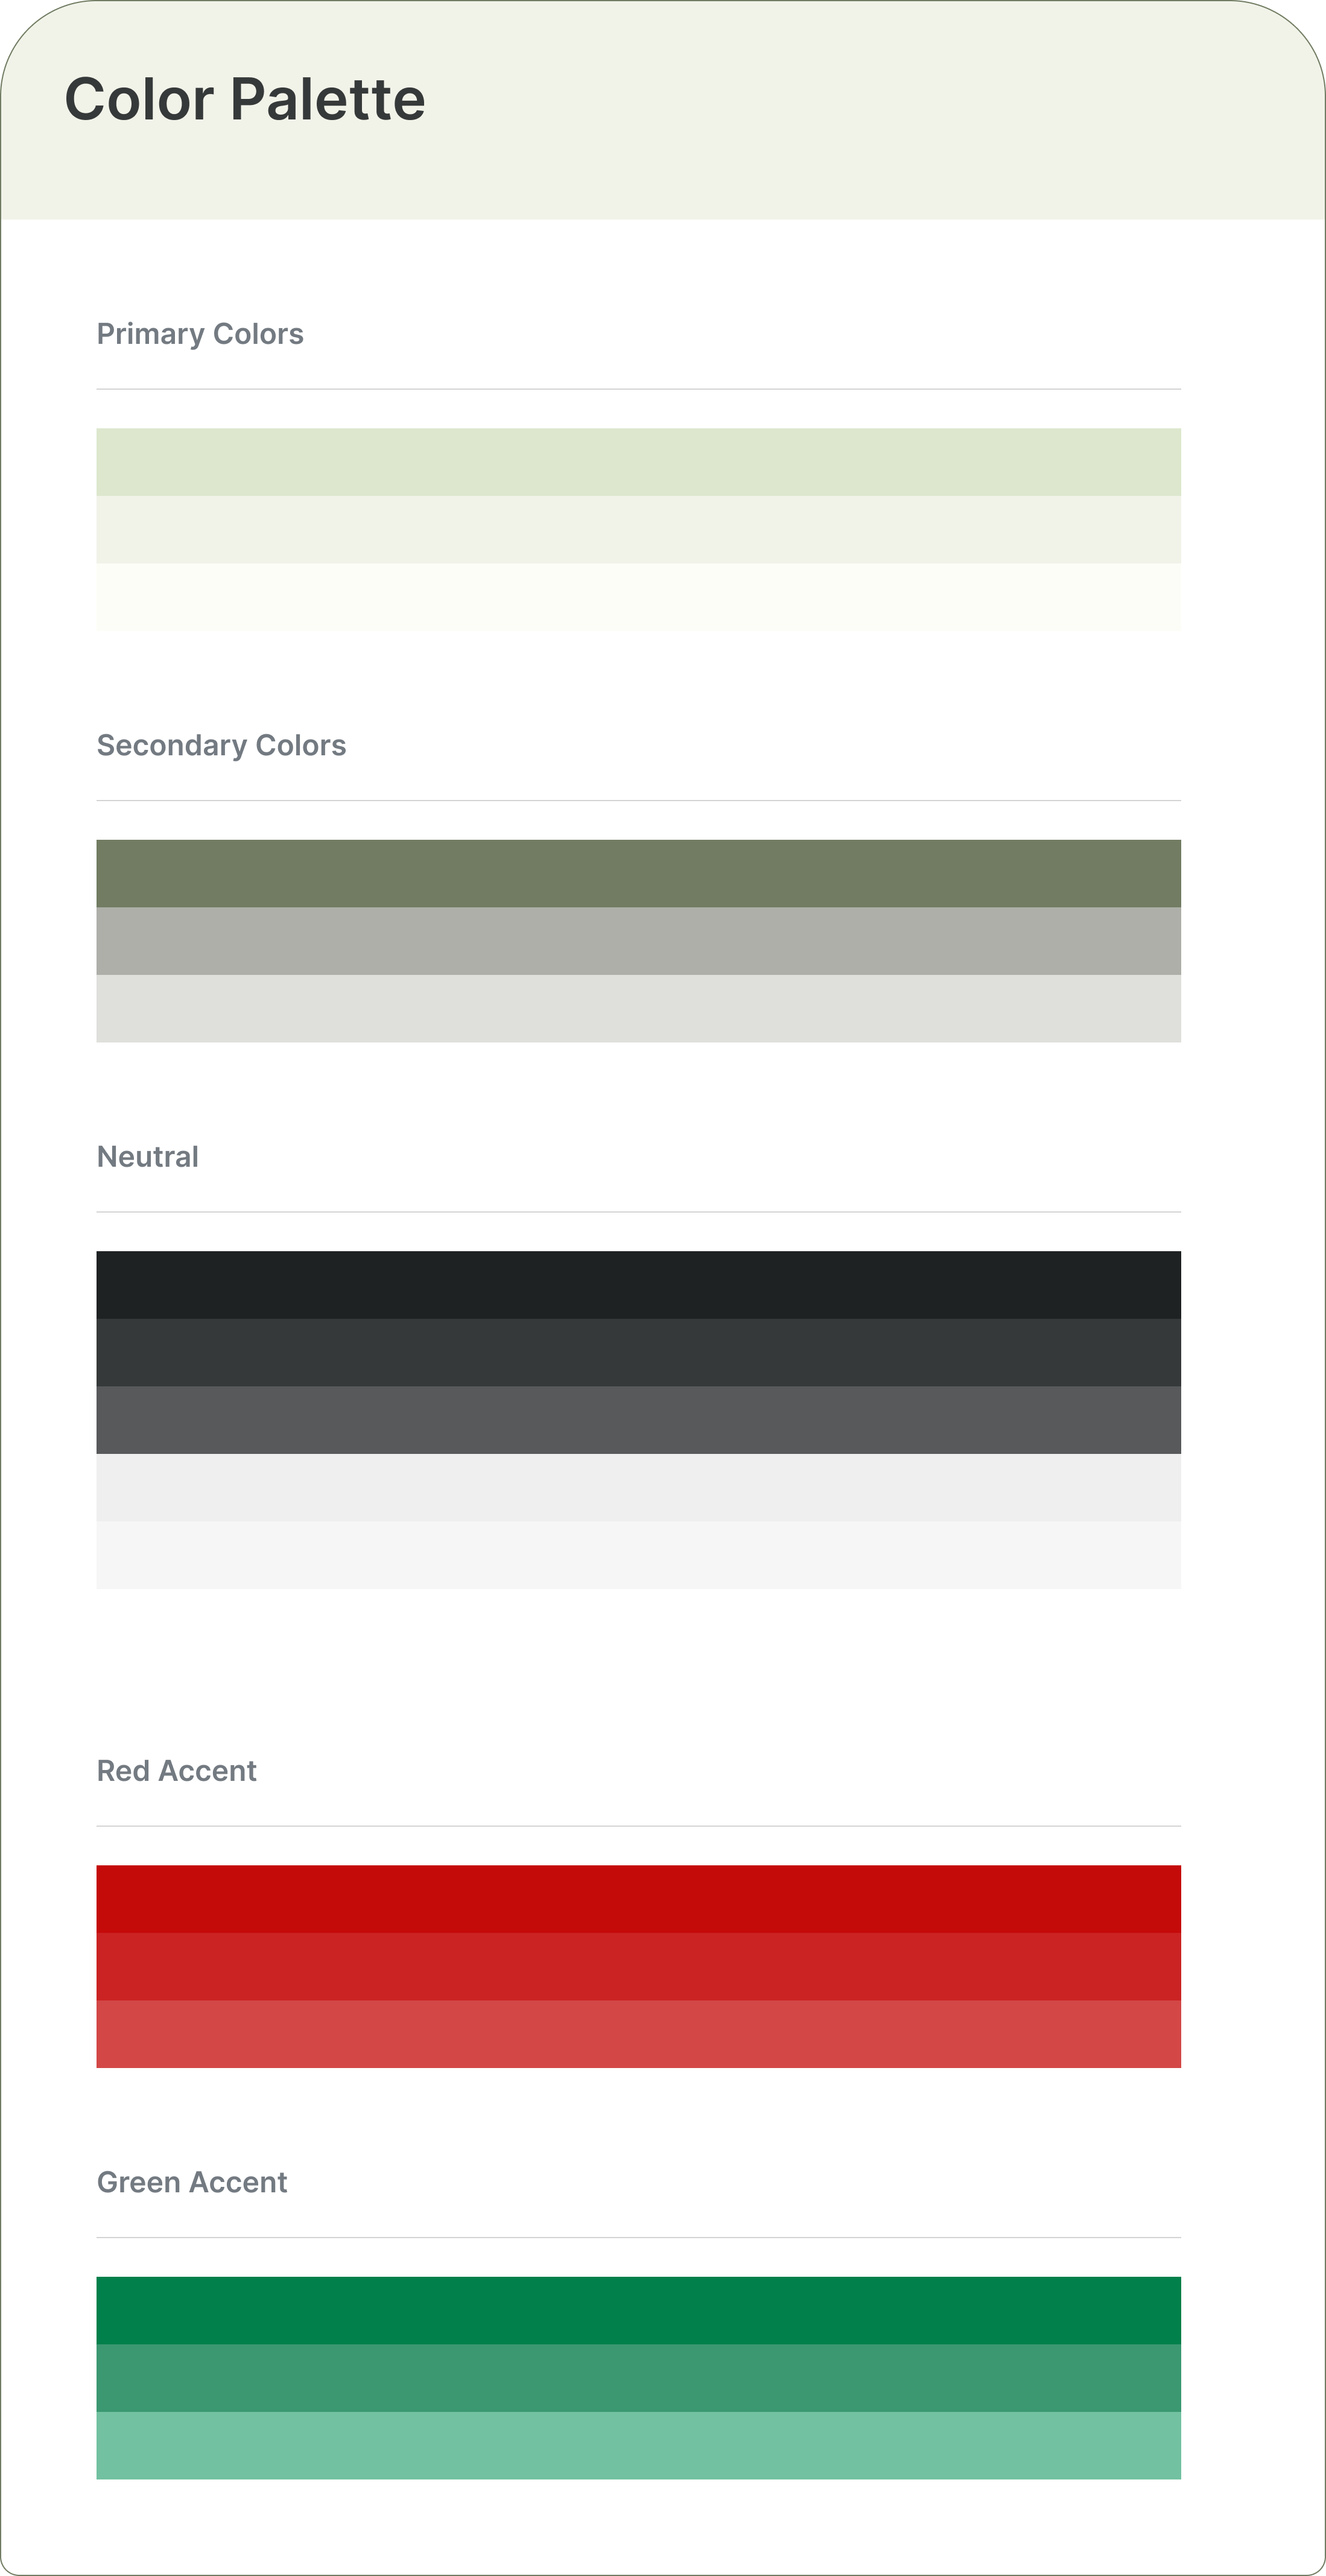
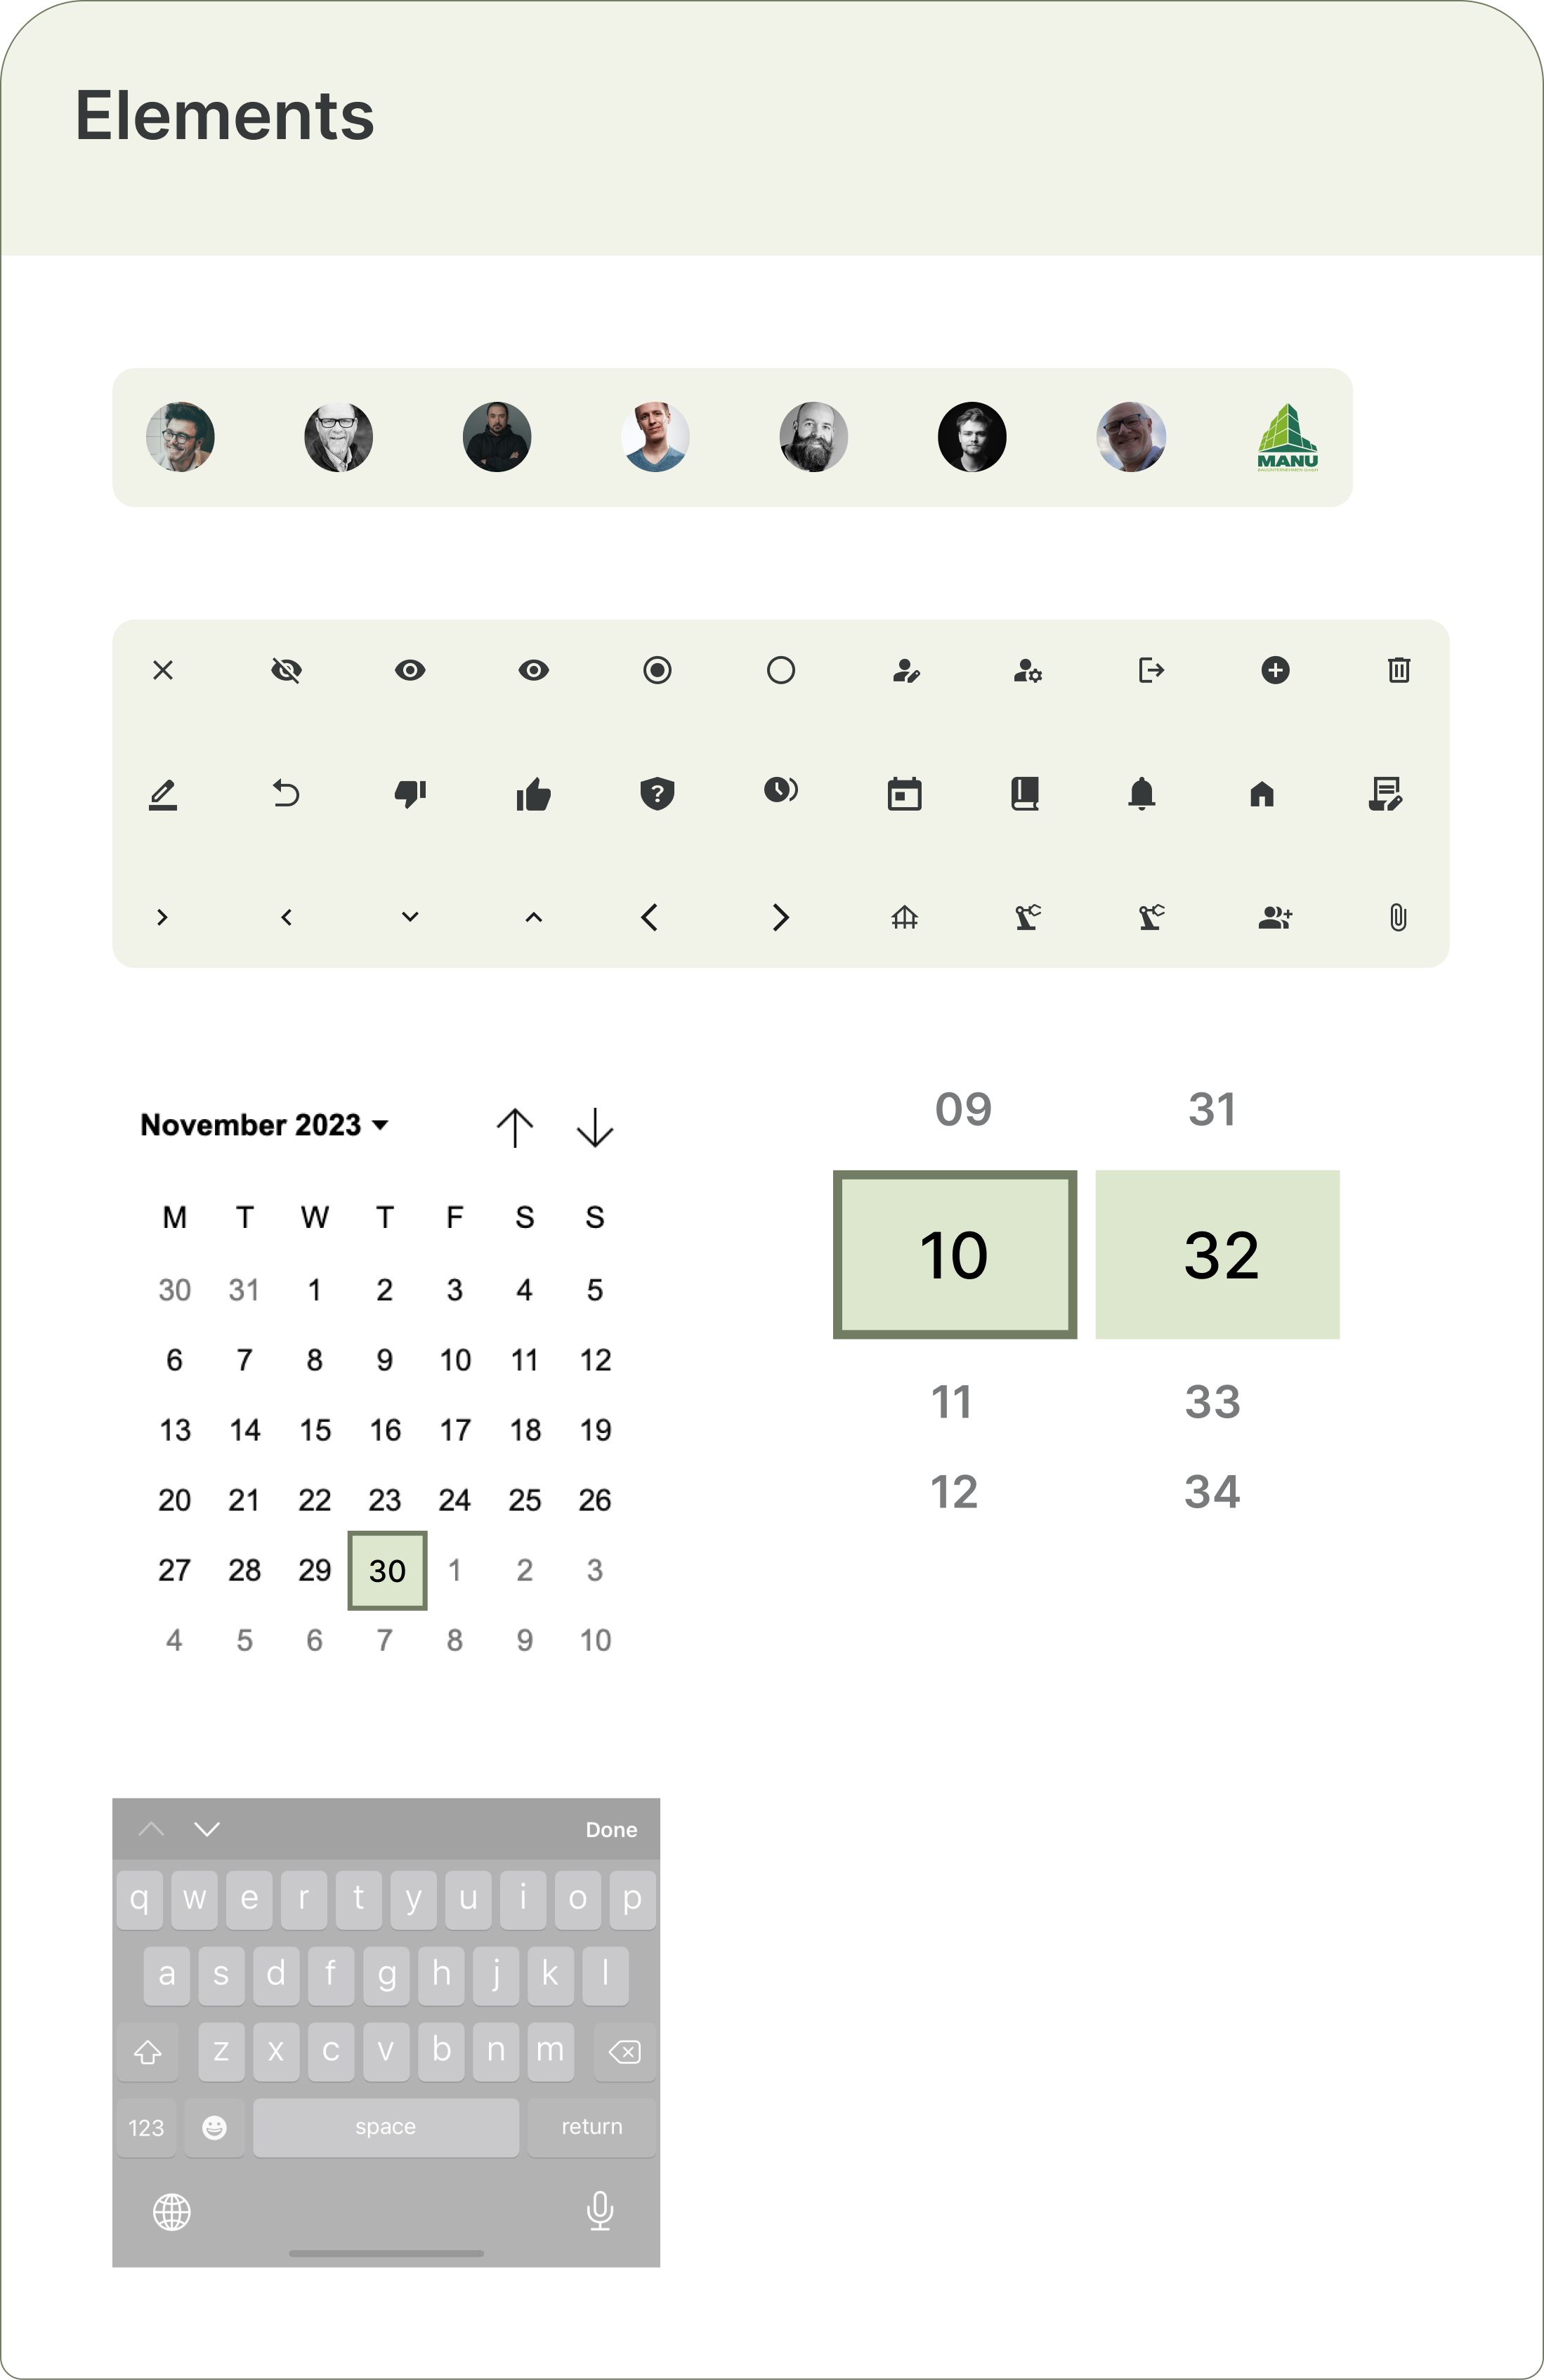
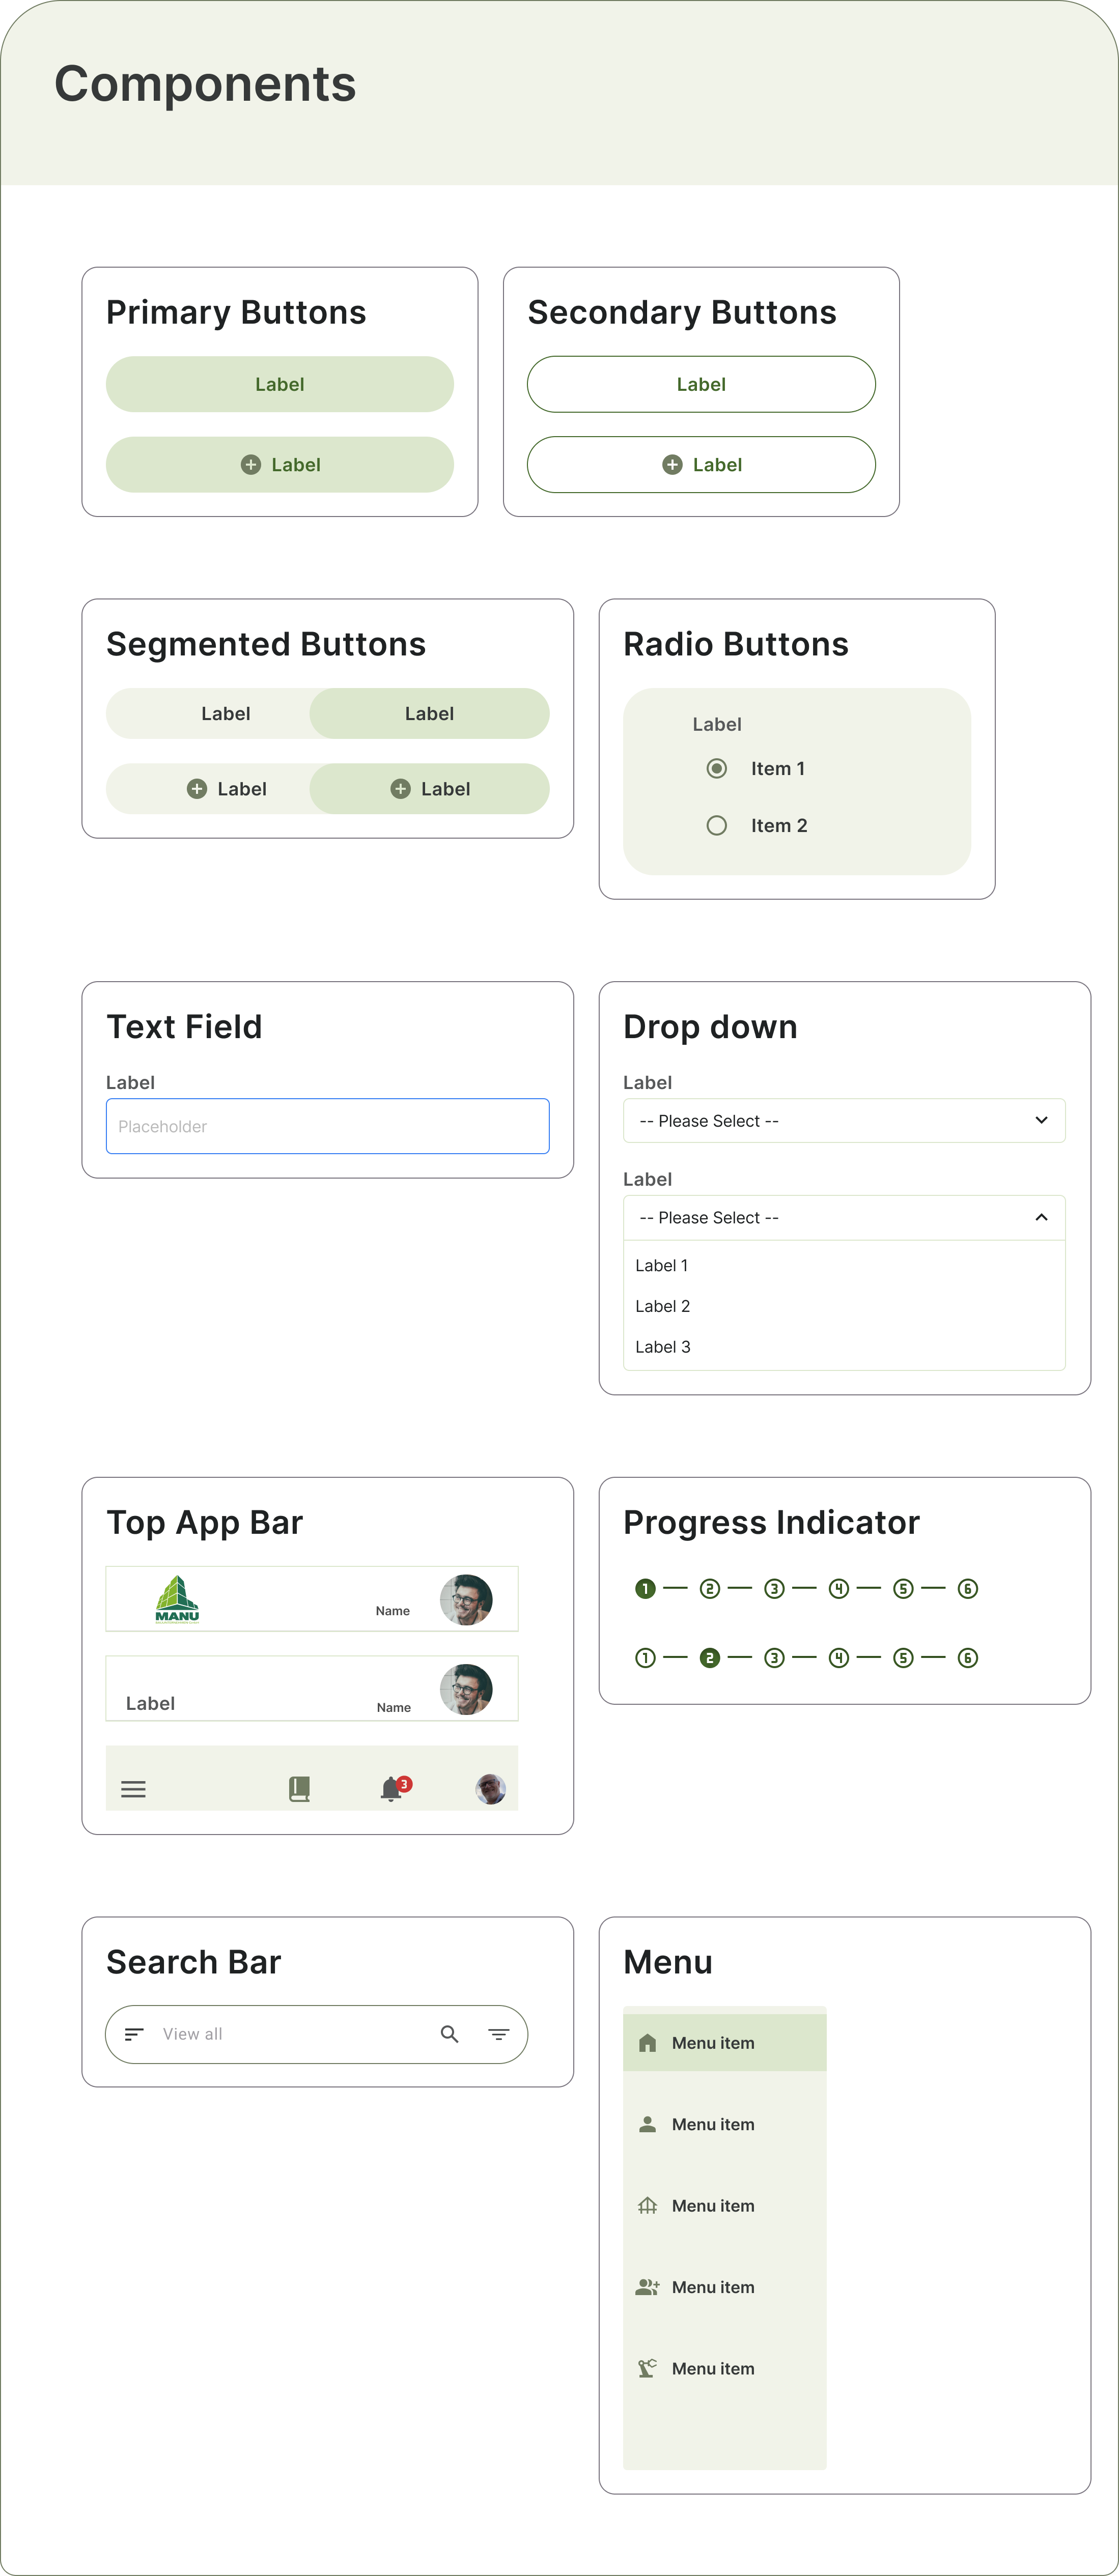
Design Artifacts
Exploring the design elements
Design Decisions
Exploring Iterations: Unveiling the Evolution of Design Choices
weather data & meter readings
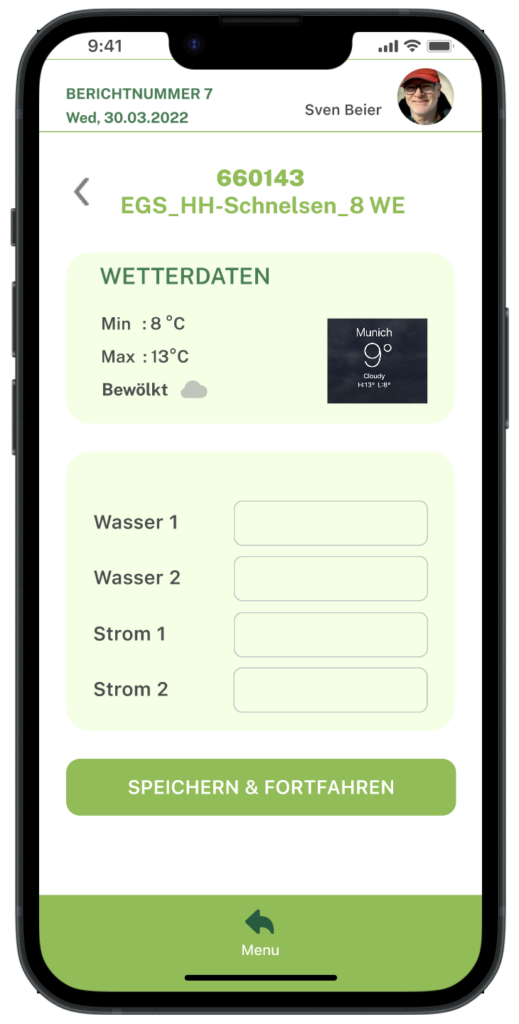
Version 1
- Concept: Automated weather updates for construction sites.
- Initial design: Manual entry of electricity and water readings daily.
- Goal: Comprehensive project documentation in the daily report.
My initial version typically serves as a wireframe, designed hastily to explore the potential functionalities and layout.
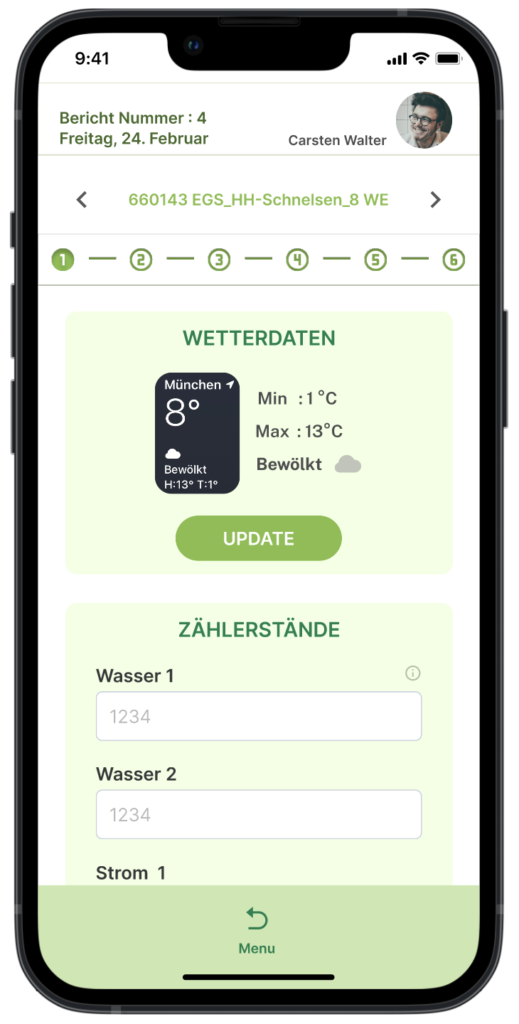
Version 2
- Added: Top indicator for step guidance.
- Introduced: ‘Update’ button for manual weather report triggering.
- Improved: Transparency and structured user experience.
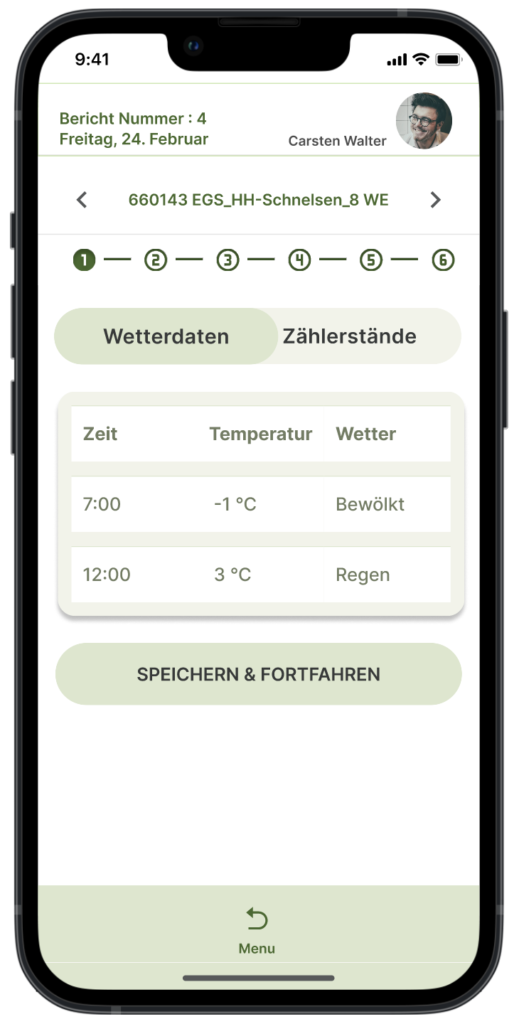
Version 3
- Responsive: Incorporated user feedback.
- Adapted: Segmented button for weather and readings.
- Adjusted: Reflective of the company’s logo color change.
- Enhanced: Brand consistency and commitment to visual identity.
- Simplified: Weather updates twice daily, readings as needed.
- Streamlined: Improved user experience and brand alignment.

